One of the problems to be solved in modern high-energy physics experiments on particle collisions with a fixed target is the visual representation of the events during the experiment run. Event display system can be used at the design stage of the detectors for:
- model and reconstruction algorithm checking and debugging by developers;
- analysis of algorithms for event data processing by experts;
- visualization of data reconstruction and physics analysis with better understanding of the detectors and collision event structure by users;
- demonstration of running and presentation of results of an experiment.
In addition, eventdisplay is required at the run stage for online visual monitoring of selected events during the experiment run with the aim of visual control and debugging of current events. Visual monitoring of physical processes and data is very important, for example, for visual estimation of the multiplicity of current events, which depends on the impact parameters of the particles.
The event display package is a part of MpdRoot environment.The event visualization uses data of the experiment as follows. The data (types of particles produced, their momenta and other kinematic parameters) obtained by event generators such as UrQMD and QGSM are passed to simulation macro transferring the particles through the detectors by particle transport packages (Geant, Fluka). The designed detector geometry in a special text format is converted by the macro into a corresponding hierarchy of class instances of the ROOT geometric shapes, transformation matrix and other graphics information that is stored in the ROOT file. After the simulation has been completed, the resulting file contains both the Monte Carlo data and the MPD geometry. The next step is the reconstruction of particle data, tracks and other parameters that are written to DST file. There construction algorithms restore the information about the particle trajectory and identity from the information contained in the simulated (or raw) detector data. The MC and DST data is stored in ROOT files in a hierarchical tree view. The last step of the data processing on the figure is physical analysis of the reconstructed data to evaluate efficiency of the simulated detector or to investigate physical properties.
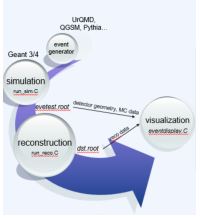
Figure1.Input data for MPDevent display
For graphical representation of the experiment, the developed eventdisplay .C macro uses both the file with the simulated data together with the MPD geometry and the DST file with the reconstructed data. The eventdisplay is integrated with the MpdRoot software to combine different stages of the event processing with a graphical representation of these events with the aim to evaluate and check the correctness of reconstruction and physical analysis algorithms. In addition, it enables one to take into account adding the subdetectors to the facility structure and changing the current configuration of the MPD setup.
To display detector geometry and events of the MPD experiment the high-level graphics package EVE is used. The ALICE collaboration developed their own base classes included in the ROOT environment as a new package EVE to provide graphical representation and management of visualization objects for high energy physics. The package uses ROOT GUI environment and OpenGL library to display three-dimensional objects and its two-dimensional projections. The EVE classes developed primarily for the creation, hits, clusters, points (TEvePointSet), and particle tracks (TEveTrack), allow selecting and management of event objects such as raw data, highlighting different elements, configuring its parameters.
To visualize events of the MPD experiment new classes were developed for the management of different physical objects and their graphical representation, e.g., hits (MpdHitDrawclass), simulated and reconstructed points and particle tracks, calorimeter towers. These classes are located in ‘eventdisplay’ directory. FairEventManager main class (inherits from TEveEventManager) was developed to perform the following functions: read events directly from ROOT tree, select events for display, apply cuts to events, event navigation (next event, previous event and go to event number), read and display the detector geometry.
The eventdisplay macro (macro/eventdisplay/eventdisplay.C) provides users with control and graphical representation of detector geometry, MCtracks and their points, as well as reconstructed hits and tracks. It reads detectors ’geometry, simulated and reconstructed event data from the generated ROOT files and displays the objects by the EVE package. All necessary options for graphical representation of the physical objects are included in the macro, set by default, and can be changed.
The main function parameters of the eventdisplay .C macro:
char* sim_geo_file – input file with MC data and/or detector geometry
char*reco_file – input file with reconstructed data for simulation or experimental events
int data_source – data source type, default:0
0 – event display for simulatated data
1–event display for experimental data
bool is_online: true-use online mode (continuous view events), false-use offline mode
(manual switching of events), default: false.
The possible options of eventdisplay.C run are presented below.
1. Display the simulated and corresponding reconstructed data.
Parameters: datasource–0, file with simulated data and detector geometry–evetest.root, file with reconstructed data – Mpddst.root. The task chain:
FairMCPointDraw *RecoilPoint = new FairMCPointDraw ("RecoilPoint", kRed, pointMarker);
fMan->AddTask(RecoilPoint);
FairMCPointDraw *MWPC1Point = new FairMCPointDraw ("MWPC1Point", kRed, pointMarker);
fMan->AddTask(MWPC1Point);
FairMCPointDraw *MWPC2Point = new FairMCPointDraw("MWPC2Point", kRed, pointMarker);
fMan->AddTask(MWPC2Point);
FairMCPointDraw *MWPC3Point = new FairMCPointDraw("MWPC3Point", kRed, pointMarker);
fMan->AddTask(MWPC3Point);
FairMCPointDraw *DCH1Point = new FairMCPointDraw("DCH1Point", kRed, pointMarker);
fMan->AddTask(DCH1Point);
FairMCPointDraw *DCH2Point = new FairMCPointDraw("DCH2Point", kRed, pointMarker);
fMan->AddTask(DCH2Point);
FairMCPointDraw *TOF1Point = new FairMCPointDraw("TOF1Point", kRed, pointMarker);
fMan->AddTask(TOF1Point);
FairMCPointDraw *TofPoint = new FairMCPointDraw("TofPoint", kRed, pointMarker);
fMan->AddTask(TofPoint);
FairMCModuleDraw *PsdPoint = new FairMCModuleDraw("PsdPoint", kRed, pointMarker);
fMan->AddTask(PsdPoint);
FairMCPointDraw *StsPoint = new FairMCPointDraw("StsPoint", mcPoi kRed ntColor, pointMarker);
fMan->AddTask(StsPoint);
FairMCTracks* GeoTrack = new FairMCTracks("GeoTracks");
fMan->AddTask(GeoTrack);
FairHitPointSetDraw *MpdGemHit = new FairHitPointSetDraw("MpdGemStripHit", kBlack, pointMarker);
fMan->AddTask(MpdGemHit);
FairHitPointSetDraw *TOF1Hit = new FairHitPointSetDraw("TOF1Hit", kBlack, pointMarker);
fMan->AddTask(TOF1Hit);
FairHitPointSetDraw *MpdDch1Hit = new FairHitPointSetDraw("MpdDch1Hit0", kBlack, pointMarker);
fMan->AddTask(MpdDch1Hit);
FairHitPointSetDraw *MpdDch2Hit = new FairHitPointSetDraw("MpdDch2Hit0", kBlack,pointMarker);
fMan->AddTask(MpdDch2Hit);
FairHitPointSetDraw *MpdTof2Hit = new FairHitPointSetDraw("MpdTof2Hit", kBlack, pointMarker);
fMan->AddTask(MpdTof2Hit);
MpdTrackDraw* MpdGlobalTrack = new MpdTrackDraw("GlobalTrack");
fMan->AddTask(MpdGlobalTrack);
The FairMCPointDraw class (inherited from FairPointSetDraw: FairTask) was developed to display simulated track points on the screen which are presented by TClonesArray class containing array of FairMCPoint objects.
The FairMCModuleDraw class (inherited from FairTask) was designed to fill array items corresponding the number of ZDC towers: 0–particles didn’t pass through the tower, 1–particles passed through the tower.
The FairMCTracks class (inherited from FairTask) was implemented to display simulated tracks on the screen stored in the GeoTracks branch as TClonesArray of GeoTrack objects containing all points through which it passes.
The FairHitPointSetDraw class (inherited from FairPointSetDraw) was developed to display reconstructed hits and tracks points on the screen, presented by TClonesArray of FairHit instances.It is also possible to graphically present hits and track points in the form of parallelepipeds using FairHitDraw class (inherited by FairBoxSetDraw class drawing FairBoxSet class–an array of little parallelepipeds).
The MpdTrackDraw class (inherited from FairTask) was implemented to display reconstructed tracks of the simulated events in the MpdRoot. It uses a specialized algorithm to pass the branches with reconstructed points and tracks of the DST file. When flag is_online is set to true value, eventdisplay continuously shows all events of evetest.root and Mpddst.root files by pressing the “Start online display” button.
2. Display the reconstructed points of MPD events for “raw” experimental data.
Parameters :datasource–1, file with detector geometry –evetest_run3.root, file with experimental raw data – Mpd_run0607_digit.root. The task chain:
MpdDigitDraw* MwpcDigit = new MpdDigitDraw("Mpd_mwpc_digit", 1, pointColor, pointMarker);
fMan->AddTask(MwpcDigit);
MpdDigitDraw* DchDigit = new MpdDigitDraw("Mpd_dch_digit", 2, pointColor, pointMarker);
fMan->AddTask(DchDigit);
The MpdDigitDraw class (inherited from FairTask) was developed to reconstruct the “raw” data – points stored in Mpd_DIGIT tree and to display the reconstructed points saved as TClonesArray of FairHit objects. The input file is opened during task initialization.
When flag is_online is set to true value, eventdisplay continuously shows all events of Mpd_run0607_digit.root files by pressing the “Start online display” button.
3.Display the reconstructed points and tracks (built by points) of experimental events stored in the ROOT file.
Parameters: datasource–1, file with detector geometry –evetest_run3.root, file with reconstructed experimental data – Mpddst_run688.root. The task chain:

MpdHitDraw* MwpcHit = new MpdHitDraw("MpdMwpcHit", pointColor, pointMarker);
fMan->AddTask (MwpcHit);
MpdHitDraw* DchHit = new MpdHitDraw("MpdDchHit", pointColor, pointMarker);
fMan→AddTask(DchHit);
MpdExpTrackDraw* MwpcTrack = new MpdExpTrackDraw("MwpcMatchedTracks", "MpdMwpcHit");
fMan->AddTask(MwpcTrack);
MpdExpTrackDraw* DchTrack = new MpdExpTrackDraw("DchTracks", "MpdDchHit");
fMan->AddTask(DchTrack);
The MpdHitDraw class (inherited from FairTask) was developed to display reconstructed track points presented by TClonesArray of FairHit objects. The input file is opened during task initialization.
The MpdExpTrackDraw class (inherited from FairTask) displays reconstructed tracks presented by TClonesArray of CbmTrack objects. The input file is opened during task initialization. The tracks are built on the points stored in the same ROOT file. When flagis_online is set to true value, eventdisplay continuously shows all events of Mpddst_run688.root files by pressing the “Start online display” button.
4.Display there constructed tracks (built by Geane package) of experimental events stored in the ROOT file.
Parameters: datasource–1, file with detector geometry – evetest_run3.root, file with reconstructed experimental data – Mpddst_run688_gl.root. The task chain:

MpdHitDraw* MwpcHit = new MpdHitDraw("MpdMwpcHit", pointColor, pointMarker);
fMan->AddTask(MwpcHit);
MpdHitDraw* DchHit = new MpdHitDraw("MpdDchHit", pointColor, pointMarker);
fMan→AddTask(DchHit);
MpdExpTrackDraw* MwpcTrack = new MpdExpTrackDraw("MwpcMatchedTracks", "MpdMwpcHit");
fMan->AddTask(MwpcTrack);
MpdExpTrackDraw* DchTrack = new MpdExpTrackDraw("DchTracks", "MpdDchHit");
fMan->AddTask(DchTrack);
The event display shows the MPD geometry and events in different projections and views, and has a multiview mode. A user can select the tab with a convenient graphical representation, set light sources, configure physical objects’ parameters, for example, specify a desired color of the object or a background color. The eventdisplay offers full interactivity, supporting on-line rotations and picking of objects. Three methods of geometry coloring were released in the visualization system: default by ROOT, hierarchical and pre-selected for detectors. In the case of hierarchical coloring, a user can choose colors for the different levels of the MPD geometry tree. If the pre-selected mode is chosen, a color can be set for each subdetector of the facility. The figure 2 presents visualization of the MPD detector in the multiview mode: 3D view together with XY and XZ projections.
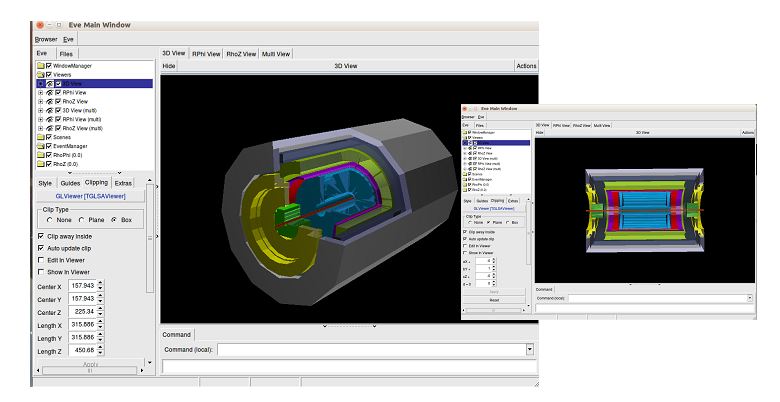
Figure 2.The views and projections of the MPD facility in the event display
The figure 3 presents MC tracks (simulated by UrQMD generator) of the central event in collisions of gold ion beam with a gold target at the energy 4GeV per nucleon. Tracks of different particles are highlighted in different colors. The EVE package provides a browser (on the left side of the window) to all the displayed objects. The object browser includes both geometry and event information presented in a hierarchical tree. Users can select in the tree individually which objects to draw, change object colors and set other visualization settings. In addition, the eventdisplay provides quick access to the following settings of event representation:
- selecting an event number displayed on the screen;
- showing all or only primary particles, particles with given PDG codes;
- setting energy range of particles to be displayed;
- changing the background of MPD views and projections;
- choosingobjectstobepresentedonthescreen:simulatedhitsandtracks,reconstructedpoints and particle tracks.
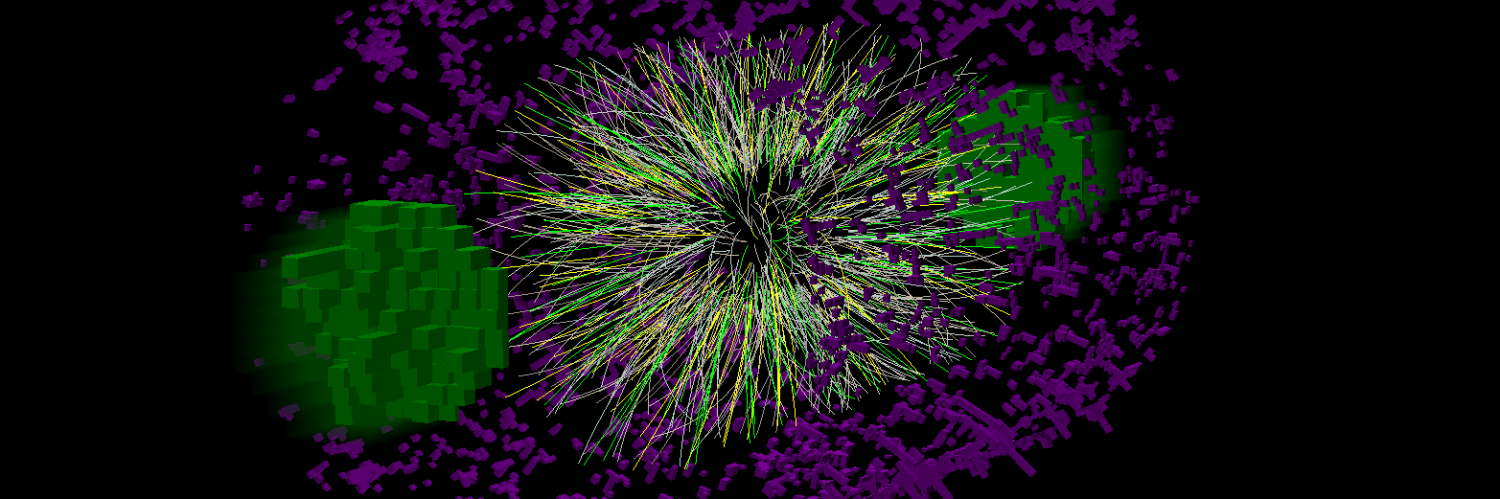
Figure 3. MPD event visualization of MC tracks in Au–Au collision at 11 GeV/nucleon
Therefore, the event display system allows one to compare the simulated and reconstructed data visually to verify the correctness of developed algorithms. In order to clearly compare hits and particle tracks the display option was implemented to hide the entire MPD geometry on the screen.